


.svg)
In today’s digital age, having a website is crucial, but understanding how it performs is equally important. Analytics tools provide invaluable insights into user behavior, helping you make informed decisions to enhance user experience and achieve your business goals. For Webflow users, integrating analytics tools is a seamless process that can elevate the performance of your website. This guide will cover some of the best analytics tools that can be integrated with Webflow, compare their features, and explain how they work.
Why Analytics Matter
Before diving into specific tools, it’s essential to understand why analytics are vital for your website. Analytics tools help you:
- Track User Behavior: Understand how visitors interact with your site, which pages they visit, and how long they stay.
- Measure Performance: Identify which content resonates with your audience and what needs improvement.
- Improve SEO: Use data to enhance your site’s search engine optimization.
- Boost Conversions: Optimize your site to increase leads, sales, or other desired actions.
- Make Data-Driven Decisions: Base your business strategies on solid data rather than guesswork.
Top Analytics Tools for Webflow
1. Google Analytics
Overview: Google Analytics is one of the most popular and comprehensive analytics tools available. It provides a wealth of data on user behavior, traffic sources, and conversion tracking.
Key Features:
- Real-time data tracking
- In-depth audience insights
- Traffic source analysis
- Conversion tracking and goal setting
- Customizable reports and dashboards
How to Integrate with Webflow:
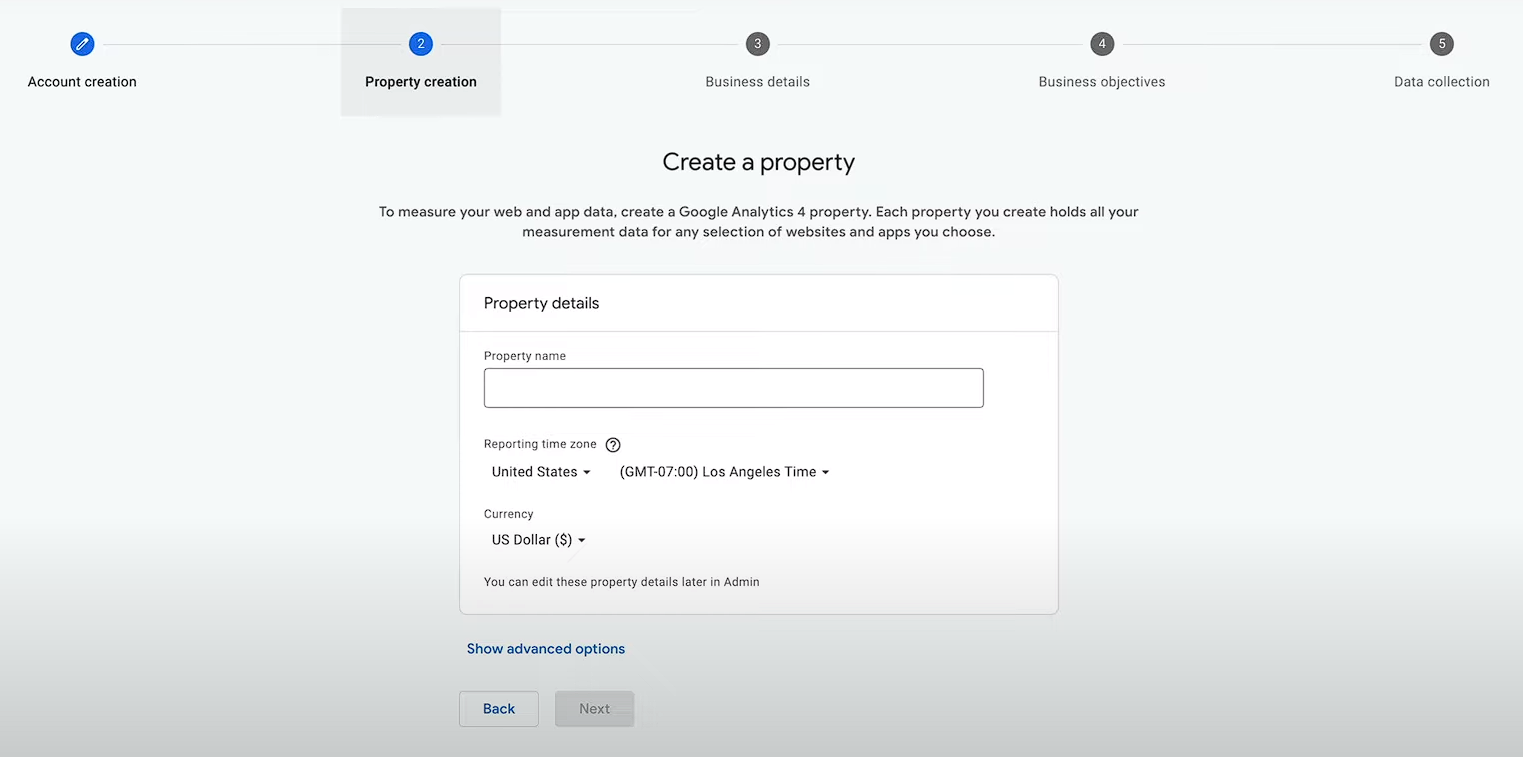
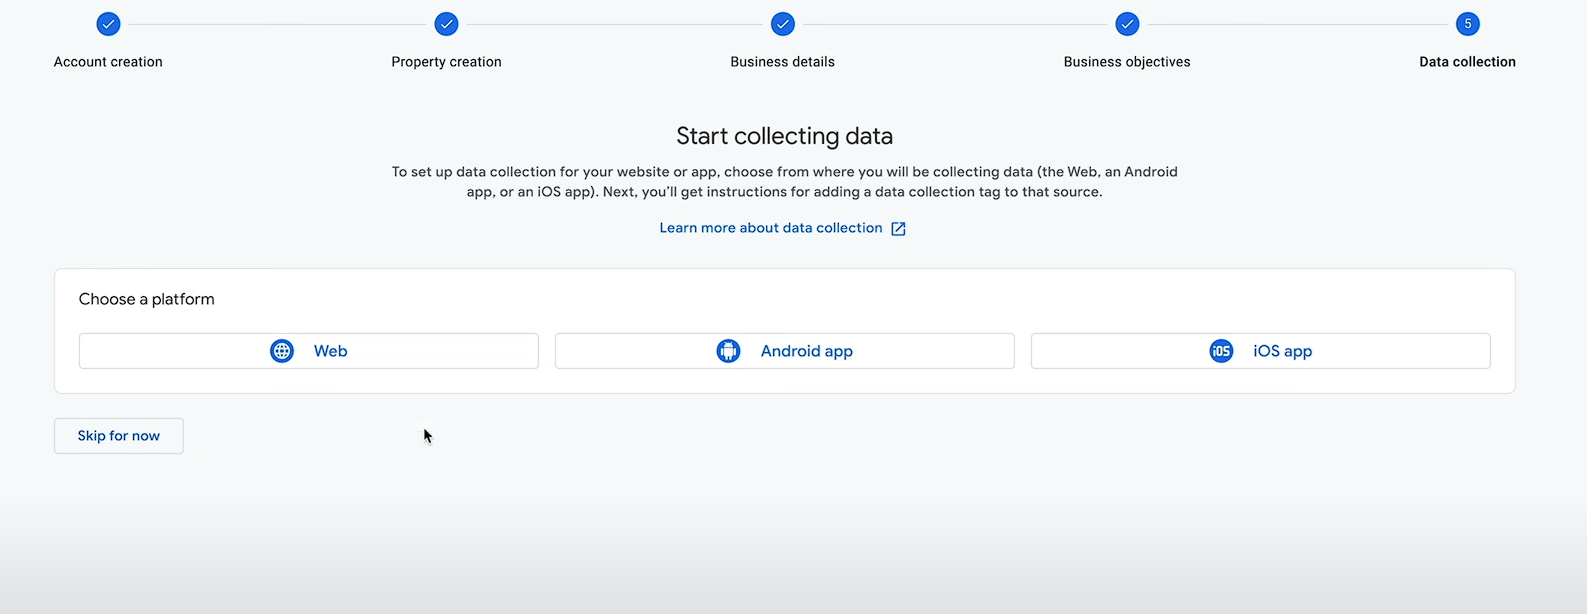
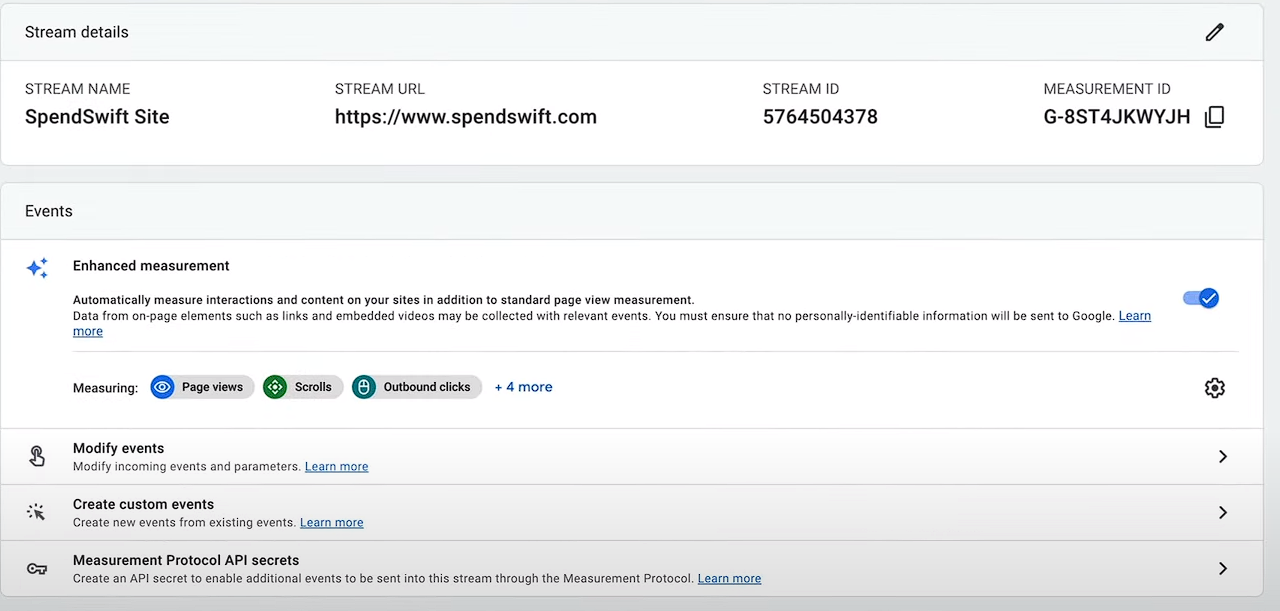
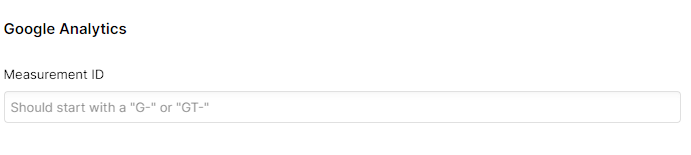
1. Create a Google Analytics account and set up a property for your Webflow site.
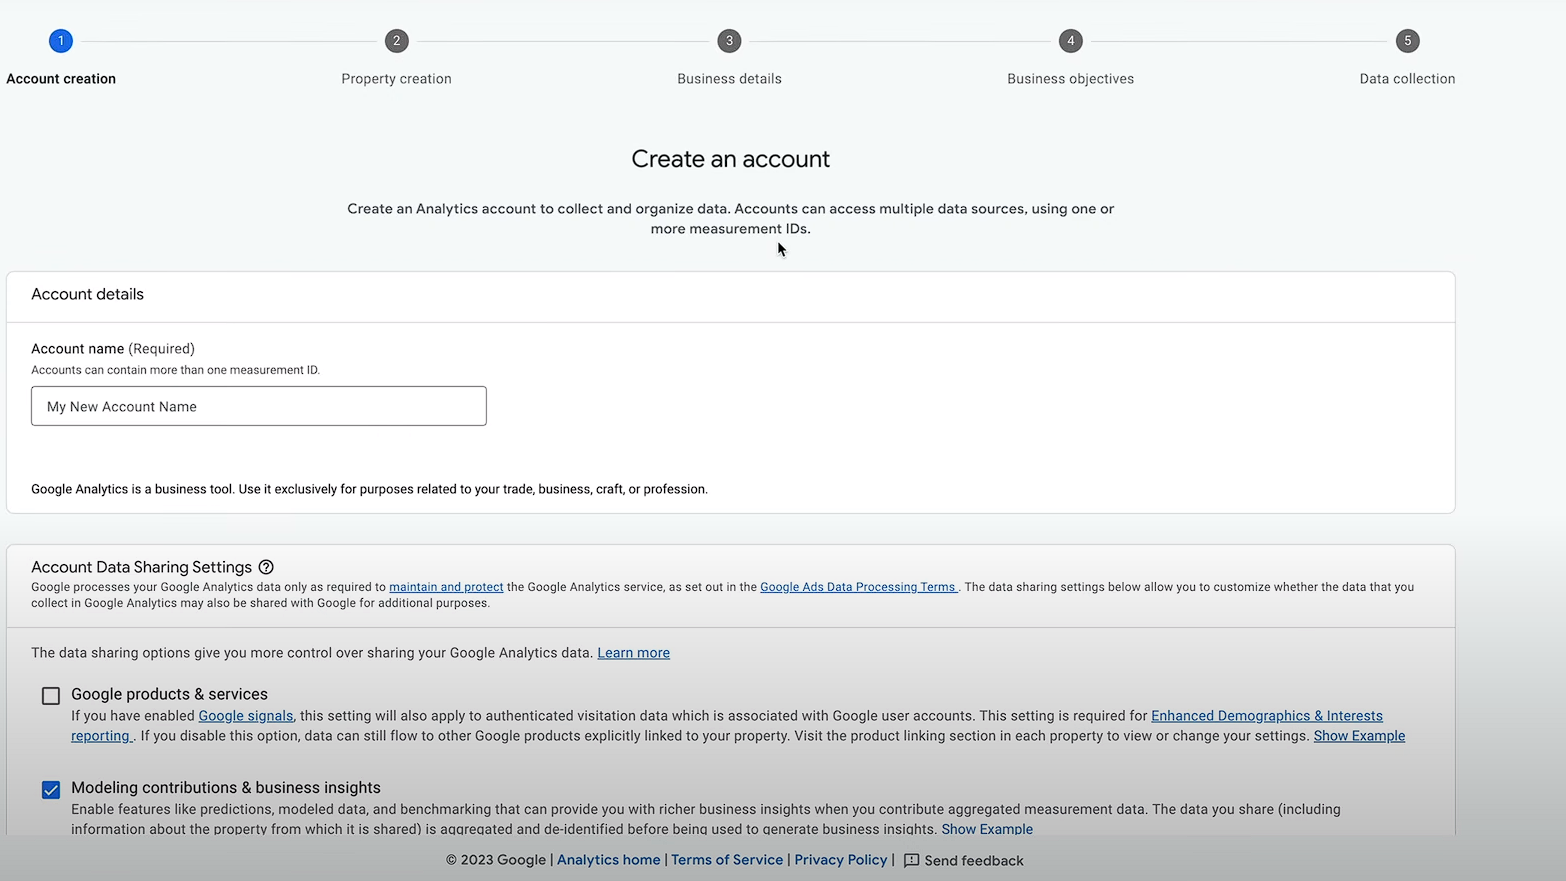
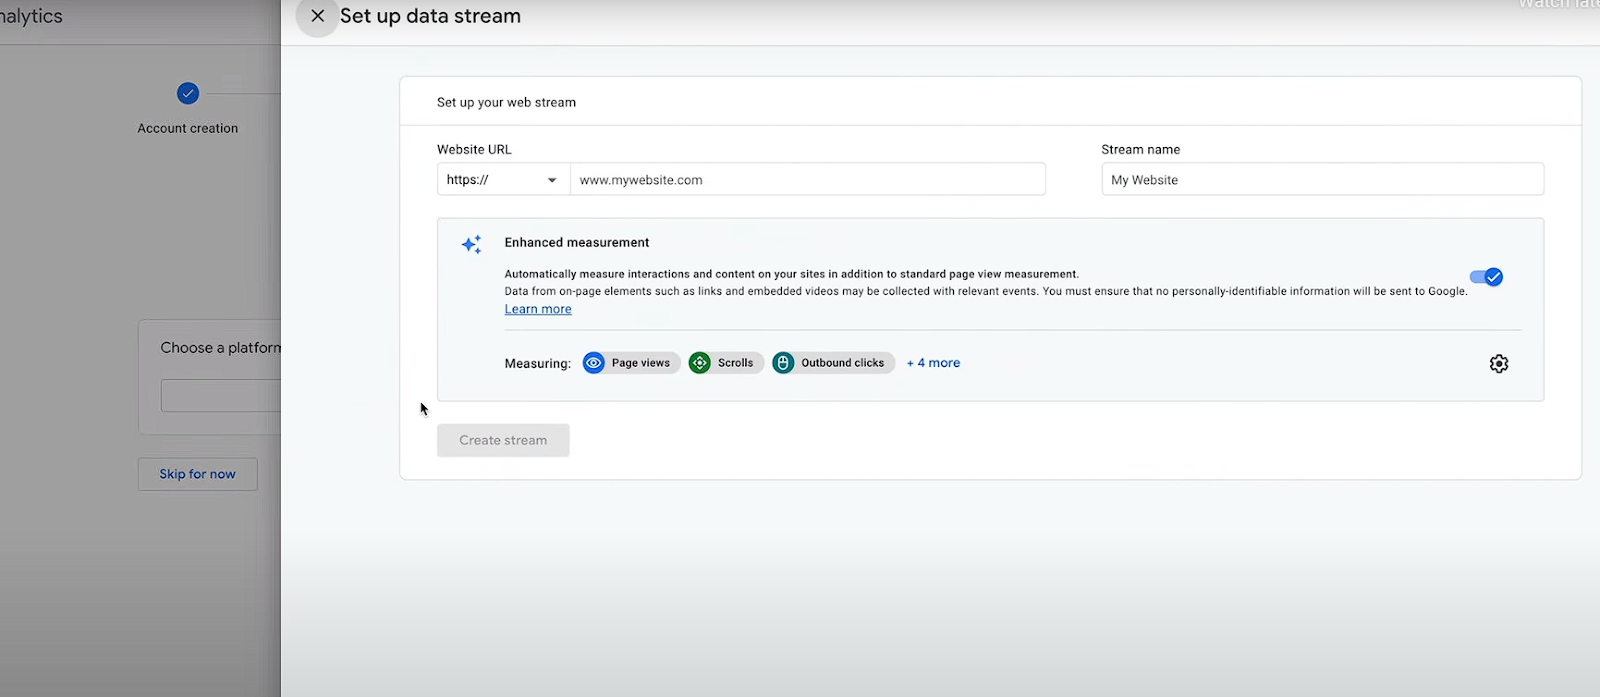
2. Copy the tracking code provided by Google.
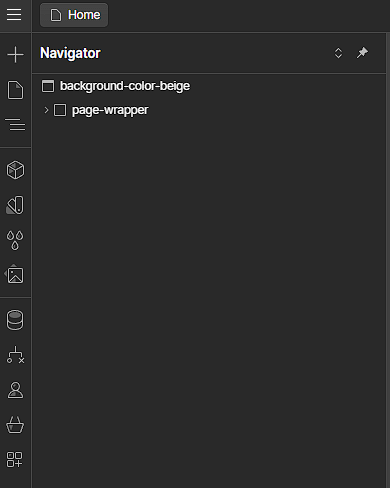
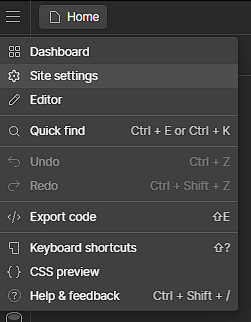
3. In Webflow, click the three dots located in the top left corner, then go to Site settings > Apps & Integrations.
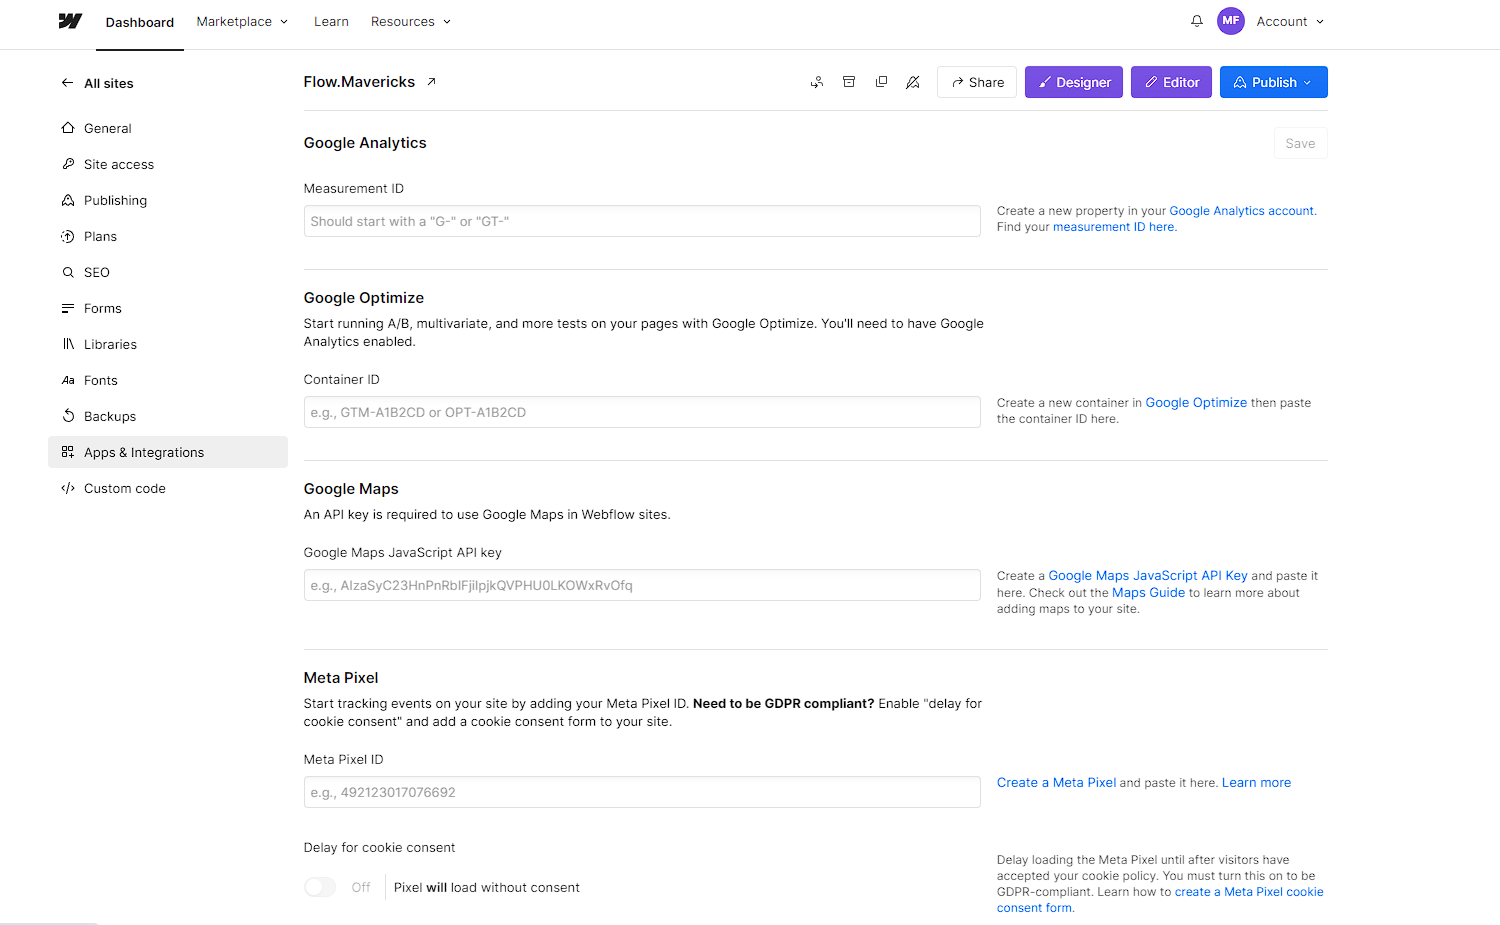
4. Paste the tracking code in the appropriate field and save changes.
2. Hotjar
Overview: Hotjar is a powerful tool that combines analytics and feedback. It provides heatmaps, session recordings, and user feedback polls.
Key Features:
- Heatmaps to visualize user interactions
- Session recordings to see user behavior in real-time
- Conversion funnels to identify drop-off points
- Feedback polls and surveys
How to Integrate with Webflow:
1. Sign up for a Hotjar account and create a new site.
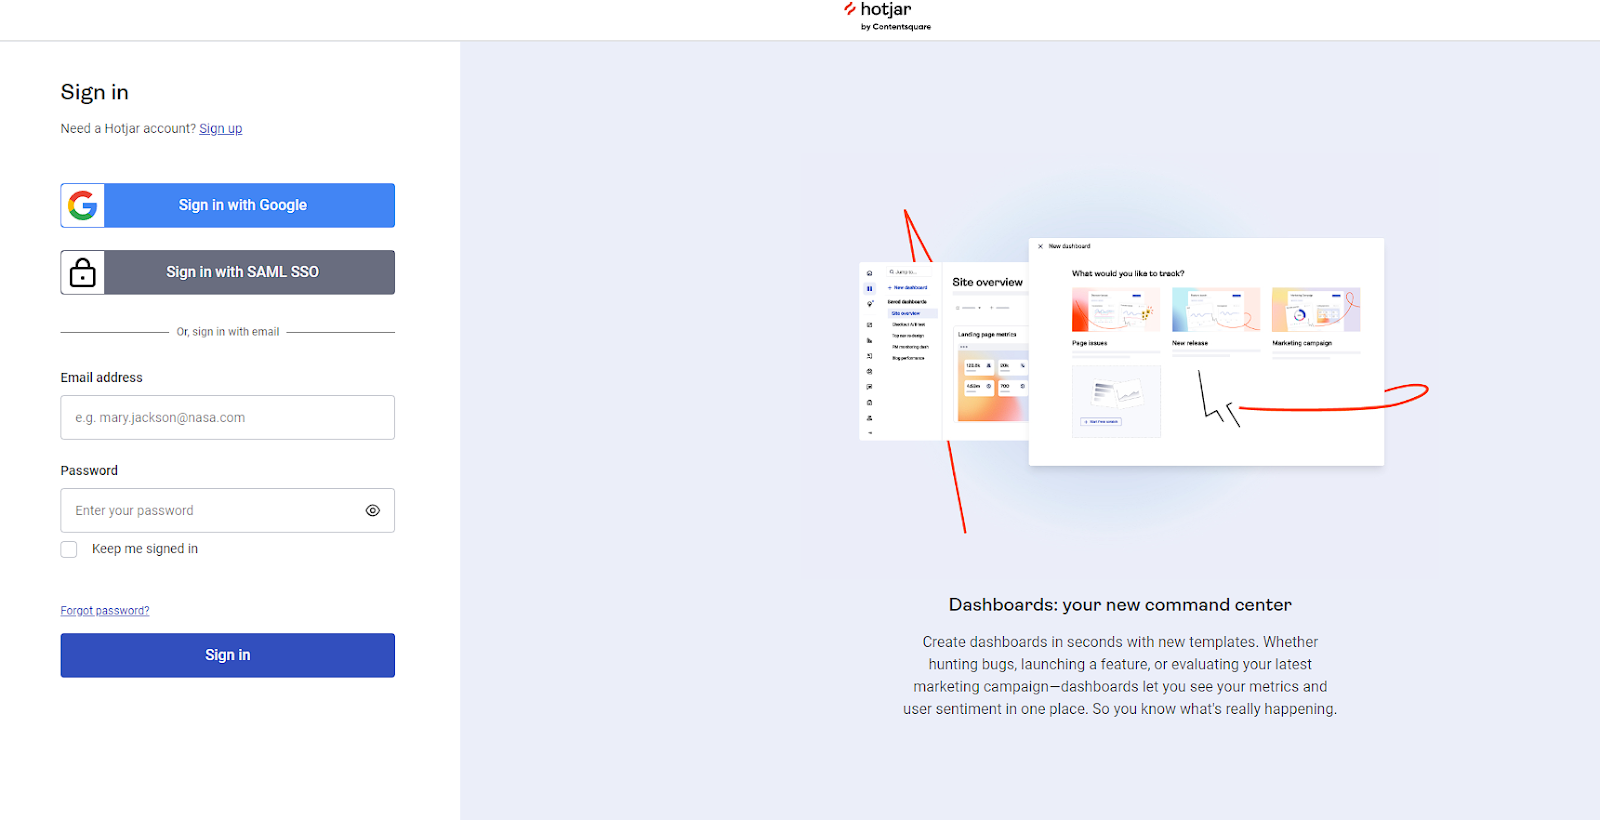
2. Copy the tracking code provided by Hotjar.

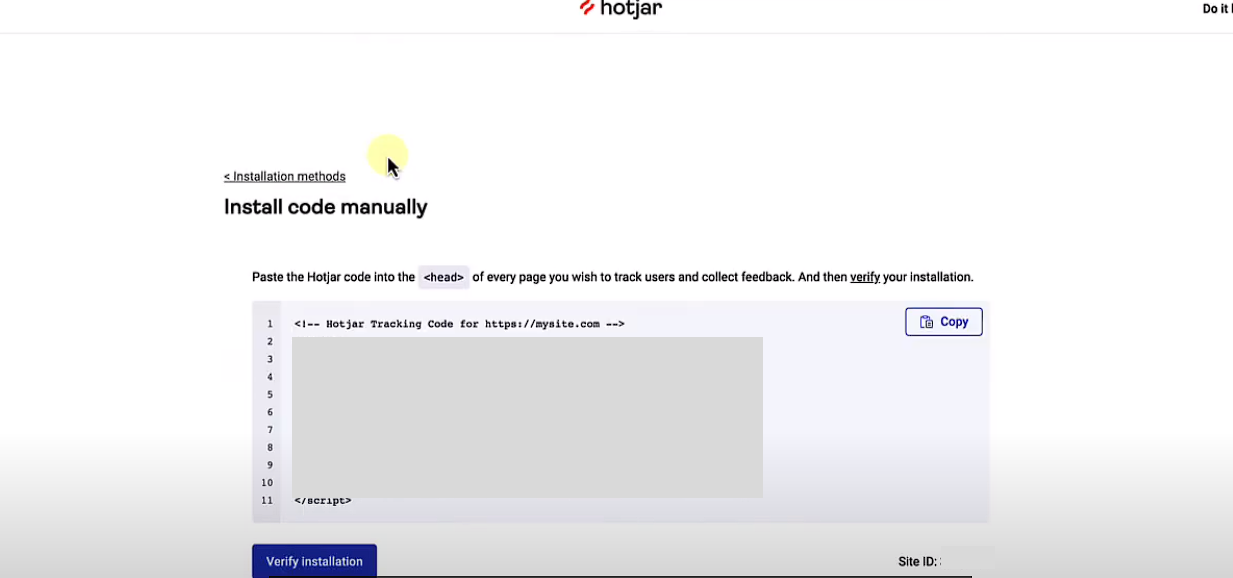
3. In Webflow, click the three dots located in the top left corner, then go to Site Settings > Custom Code.
4. Paste the tracking code in the head section of your site.

3. Mixpanel
Overview: Mixpanel is an advanced analytics platform focused on tracking user actions and events. It’s great for understanding how users engage with your site.
Key Features:
- Detailed event tracking
- Funnel analysis
- Cohort analysis
- A/B testing and experimentation
- User profiles and segmentation
How to Integrate with Webflow:
1. Create a Mixpanel account and set up your project.
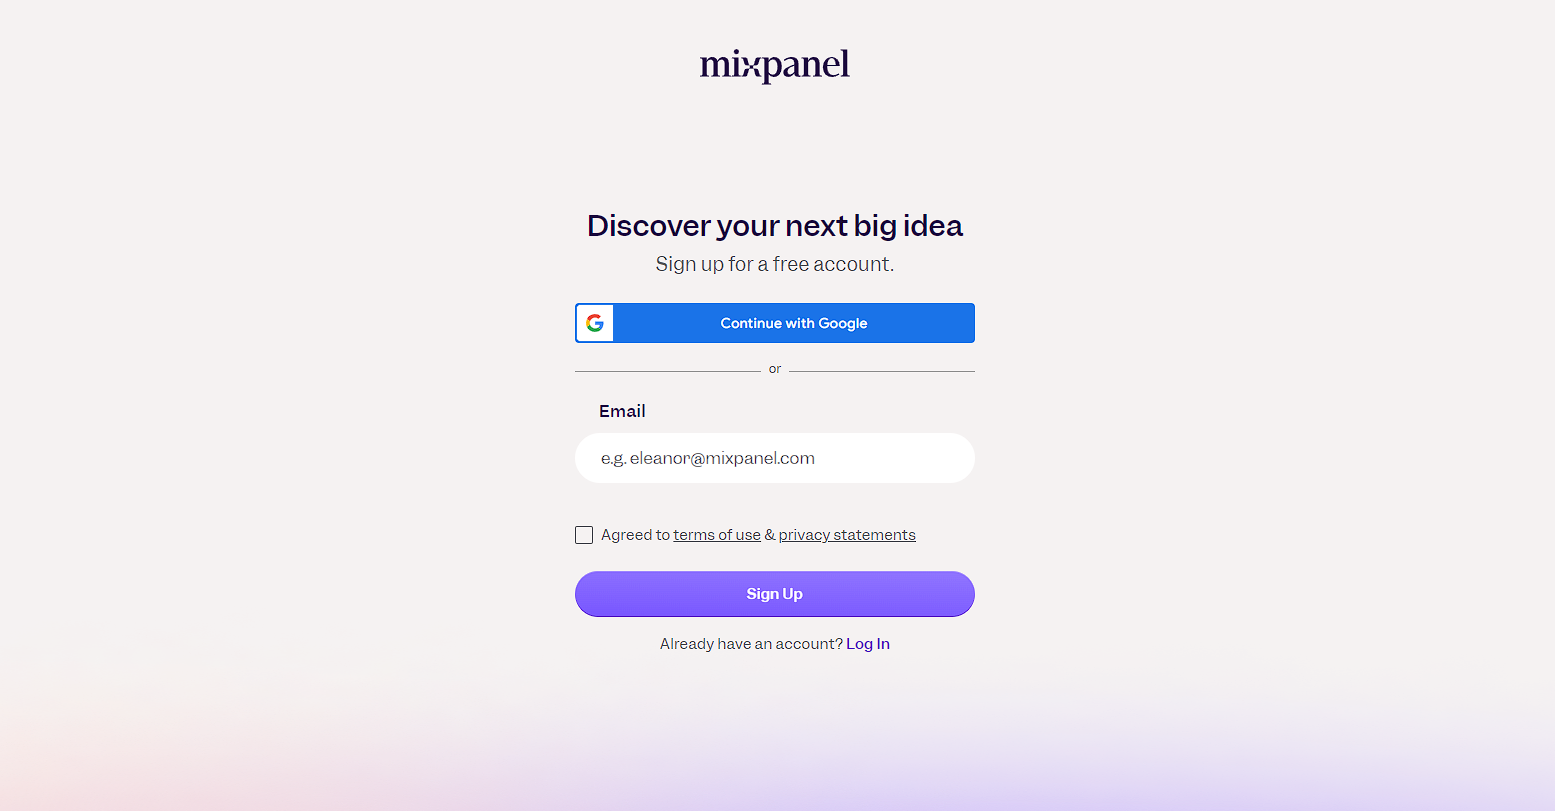
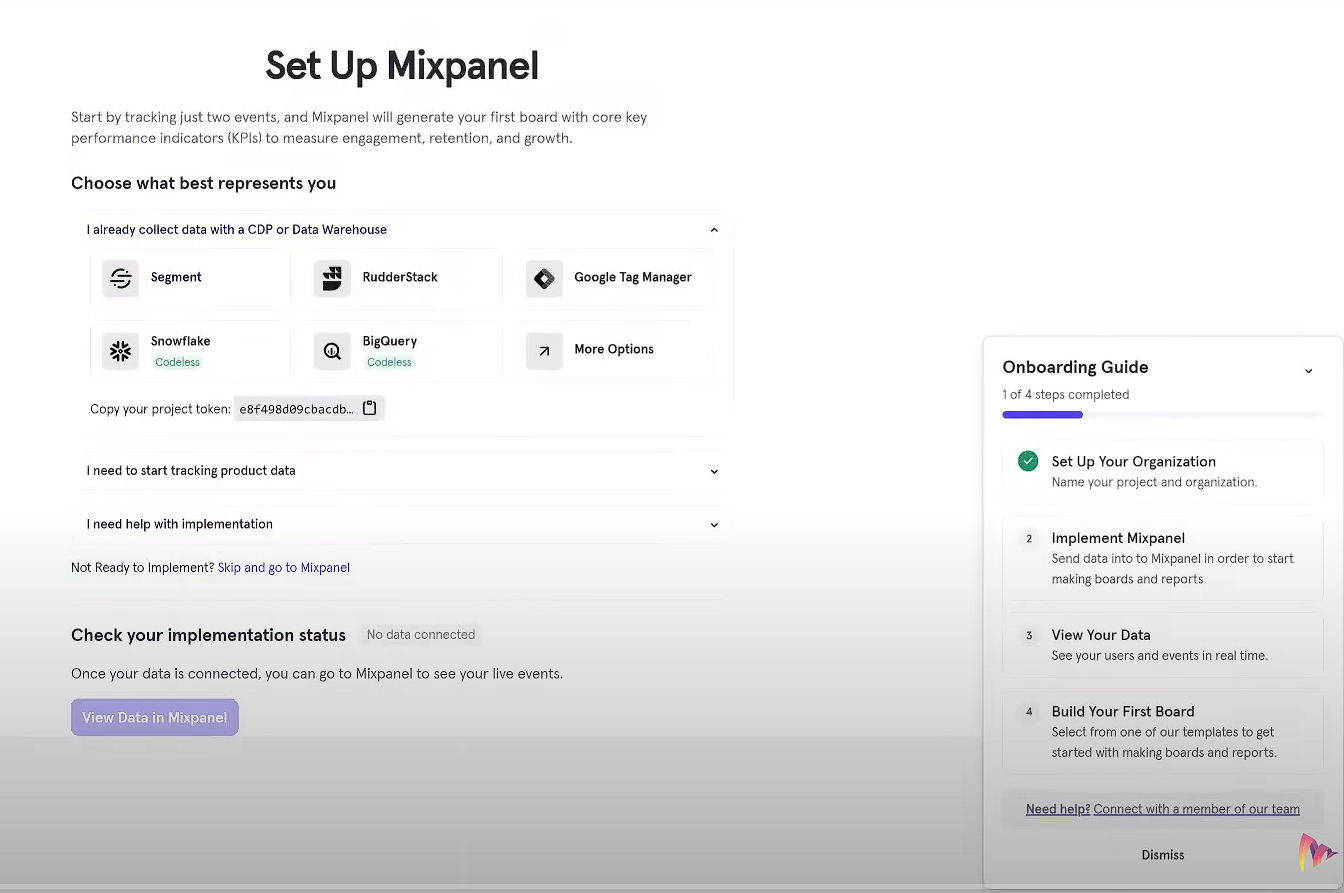
2. Obtain the tracking code from Mixpanel.
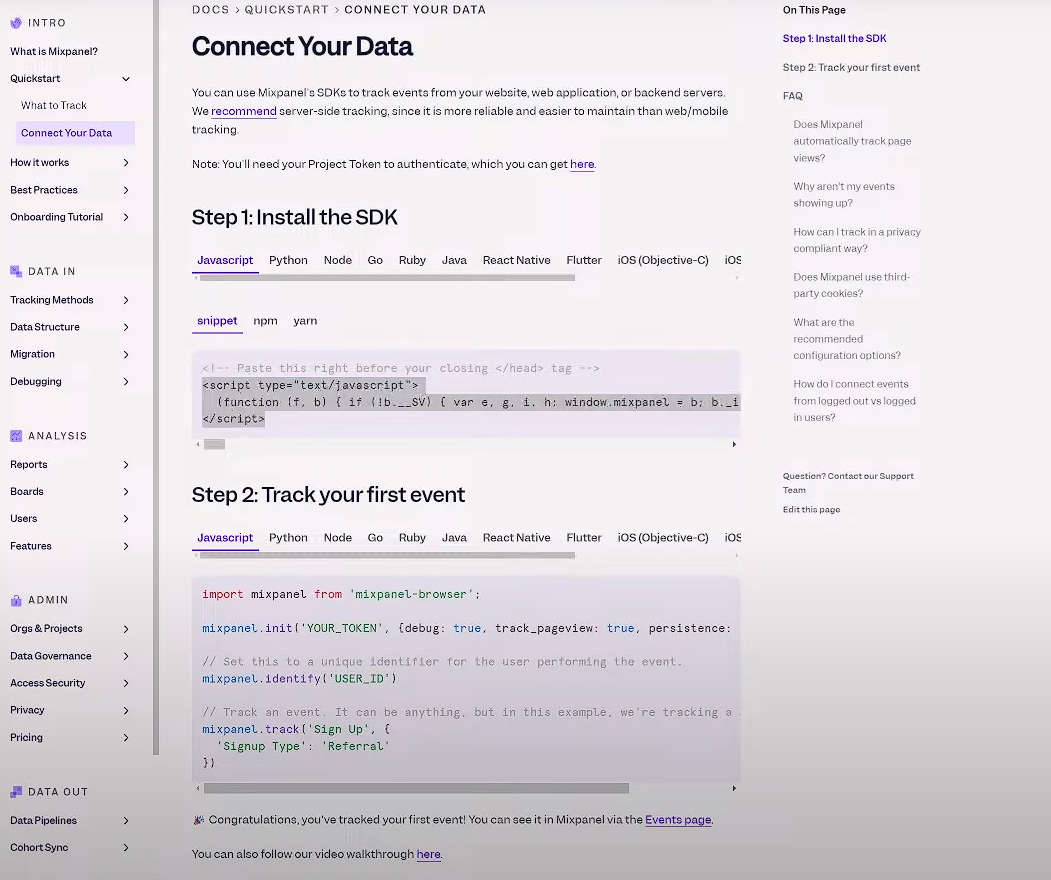
3. In Webflow, click the three dots located in the top left corner, then go to Site Settings > Custom Code.
4. Insert the code into the head section of your website.
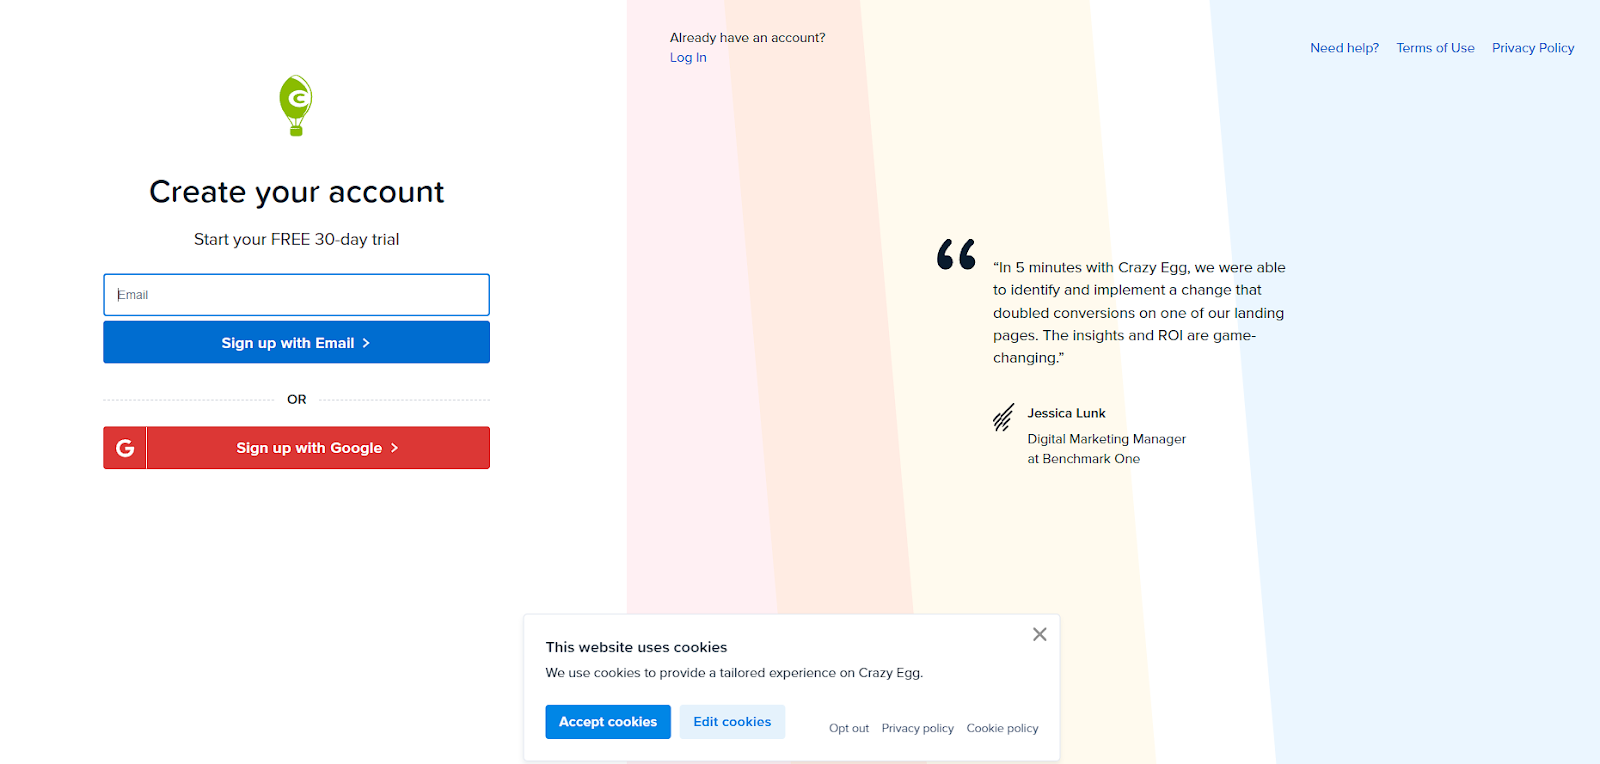
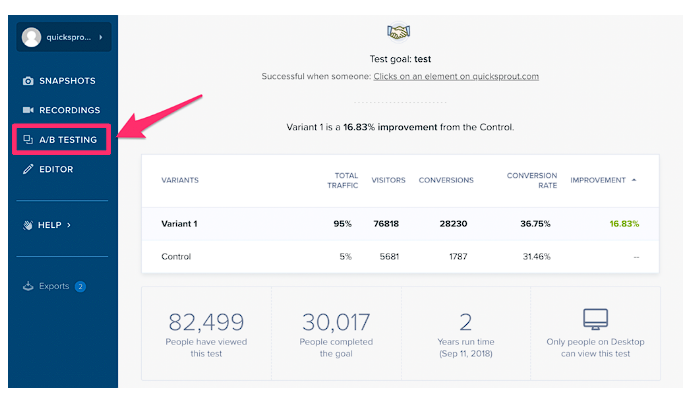
4. Crazy Egg
Overview: Crazy Egg provides visual analytics through heatmaps and scroll maps. It helps you understand how users interact with your pages and where they drop off.
Key Features:
- Heatmaps to see where users click
- Scroll maps to understand how far users scroll
- A/B testing to optimize page elements
- User recordings to watch real-time interactions
How to Integrate with Webflow:
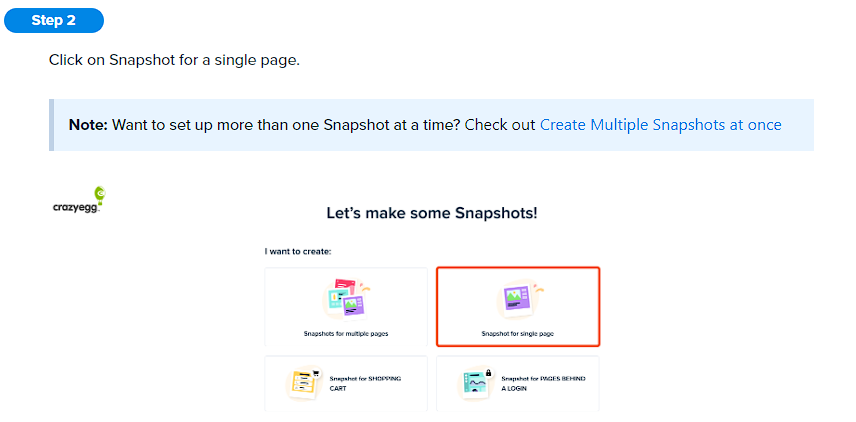
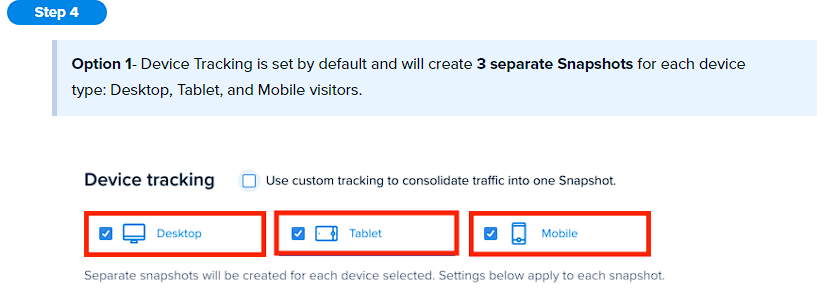
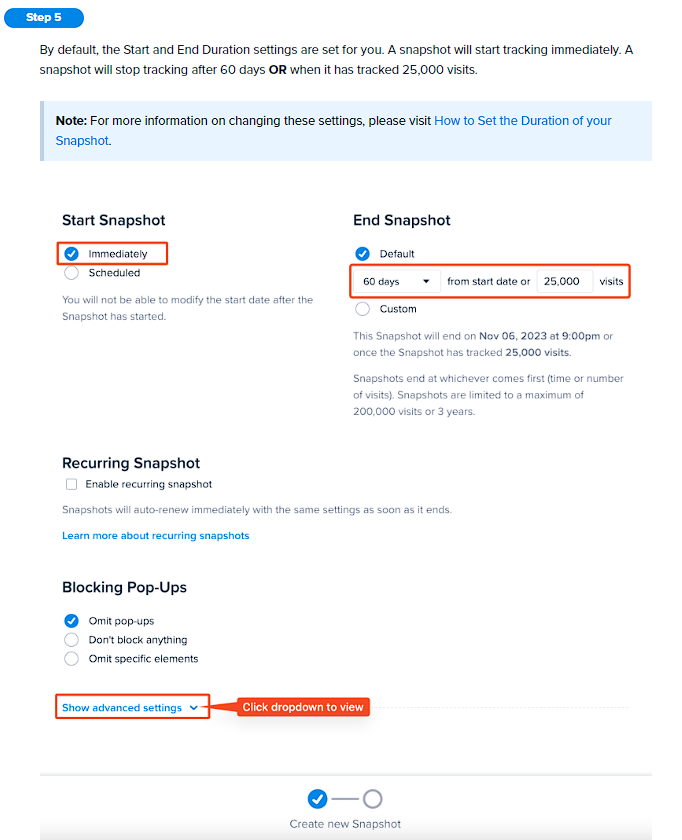
1. Sign up for a Crazy Egg account and create a new snapshot.
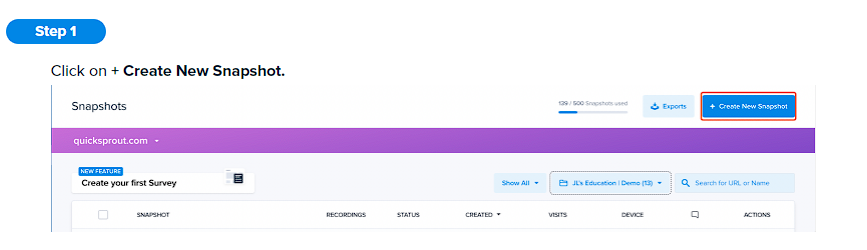

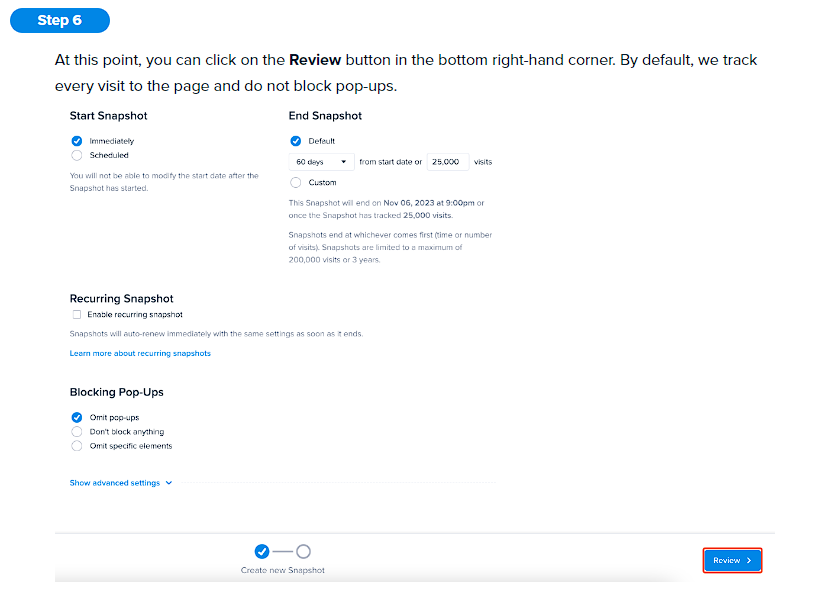
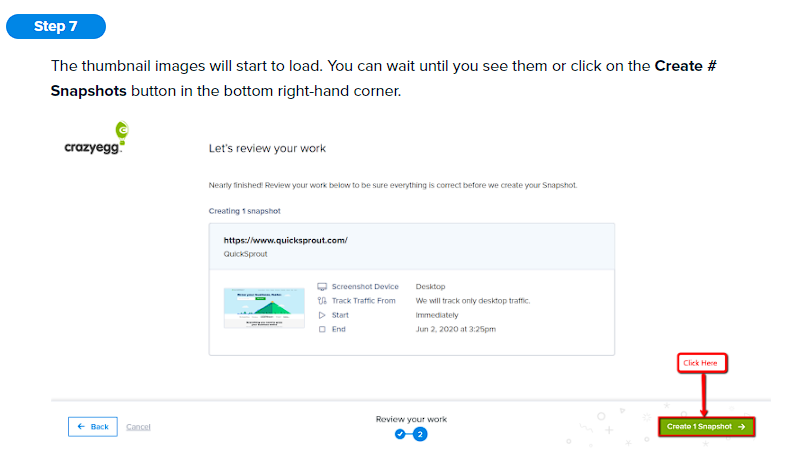
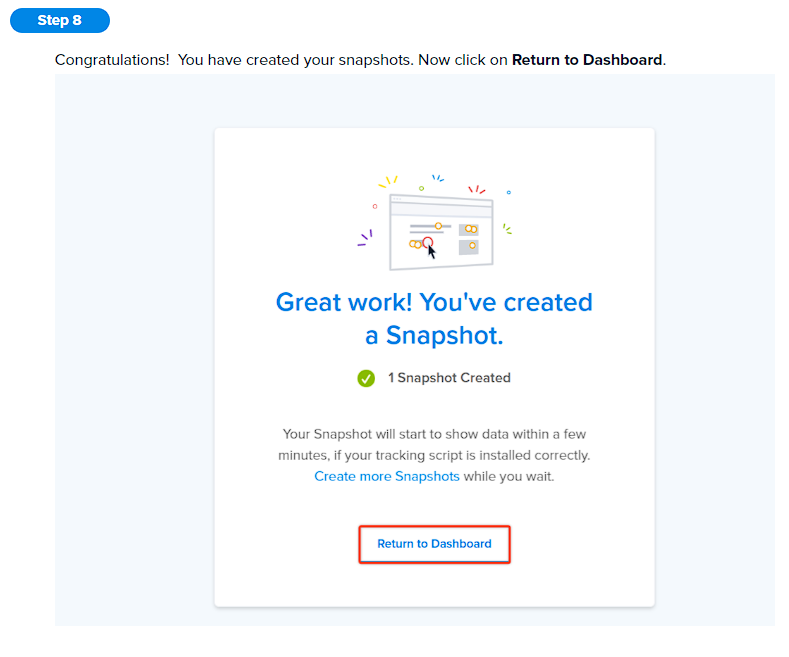
2. Copy the provided tracking code.
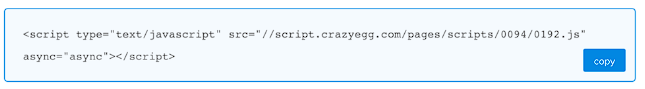
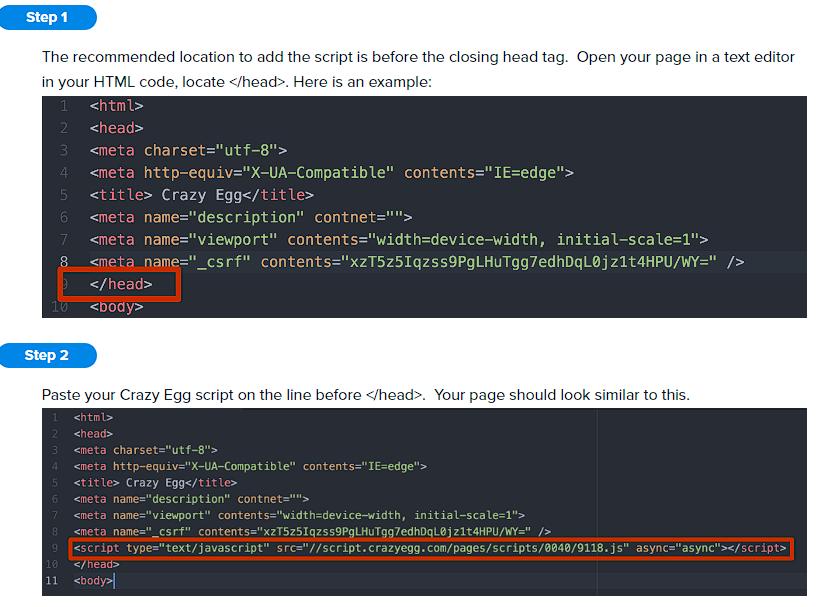
3. In Webflow, click the three dots located in the top left corner, then go to Site Settings > Custom Code.
4. Paste the code in the head section of your site.
Comparison of Tools
Here is a brief comparison to help you decide which tool might be best for your needs:
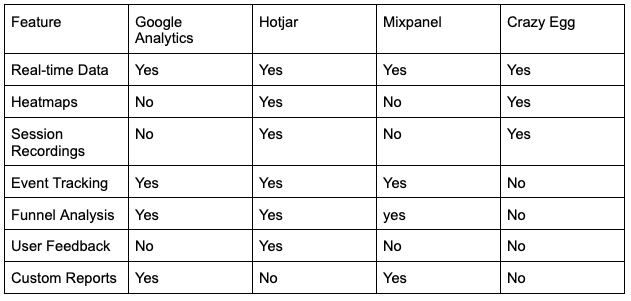
Feature Explanations:
- Real-time Data: Provides immediate insights into user activity as it happens.
- Heatmaps: Visual representation showing where users click, move, and scroll on your page.
- Session Recordings: Video recordings of user interactions on your site.
- Event Tracking: Monitors specific user actions, like clicks, form submissions, and downloads.
- Funnel Analysis: Tracks the steps users take to complete a goal, helping identify where drop-offs occur.
- User Feedback: Collects direct feedback from users through polls and surveys.
- Custom Reports: Allows you to create tailored reports to analyze specific data points.
When to Use Each Tool:
- Google Analytics: Best for comprehensive data analysis and tracking a wide range of metrics. Ideal for businesses looking to get detailed insights into user behavior and site performance.
- Hotjar: Great for visual insights and understanding user interactions through heatmaps and session recordings. Perfect for identifying UX issues and gathering user feedback.
- Mixpanel: Suitable for advanced event tracking and user engagement analysis. Ideal for product-focused sites where understanding user actions is crucial.
- Crazy Egg: Excellent for visualizing user behavior and conducting A/B tests. Best for sites that need to optimize page elements and improve user flow.
Pricing Comparison:
- Google Analytics: Free for basic features; Google Analytics 360 for enterprise-level features (contact sales for pricing).
- Hotjar: Free plan available; Paid plans start at $39/month, offering more heatmaps, recordings, and advanced features.
- Mixpanel: Free plan available; Paid plans start at $25/month, providing additional data points and advanced analysis tools.
- Crazy Egg: Free trial available; Paid plans start at $24/month, offering more snapshots, recordings, and heatmaps.
Conclusion
Integrating analytics tools with Webflow can significantly enhance your understanding of user behavior and site performance. Whether you choose Google Analytics for its comprehensive data, Hotjar for its visual insights, Mixpanel for advanced event tracking, or Crazy Egg for its heatmaps, each tool offers unique benefits that can help you make data-driven decisions. By leveraging these tools, you can optimize your Webflow site, improve user experience, and achieve your business objectives.
.png)

.png)


.png)
.png)